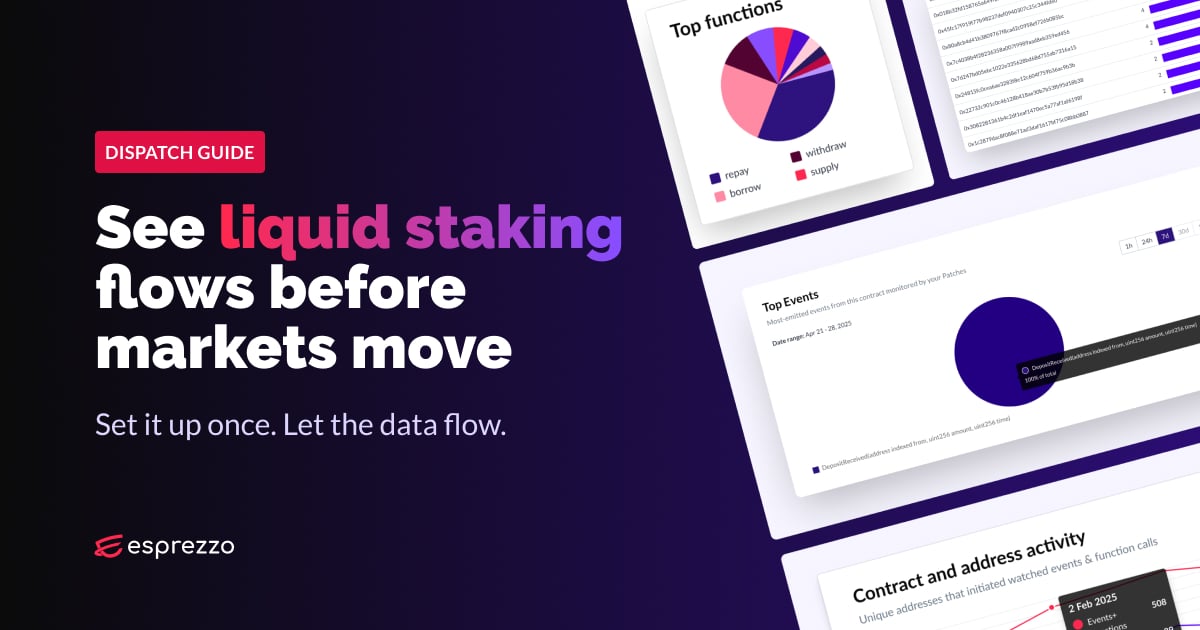
Crypto staking flows reveal critical market signals that often precede narratives and price movements. When investors deposit or withdraw assets from staking protocols, they're making capital decisions that reflect confidence, risk appetite, and market sentiment. Whether you’re tracking trends for yourself or your team, monitoring these flows can provide a real edge: early visibility into capital movement and evolving on-chain behavior.
How to track liquid staking flows in real time and see what others miss
Topics: Tutorials
Read moreHow to see DeFi activity patterns with Dispatch
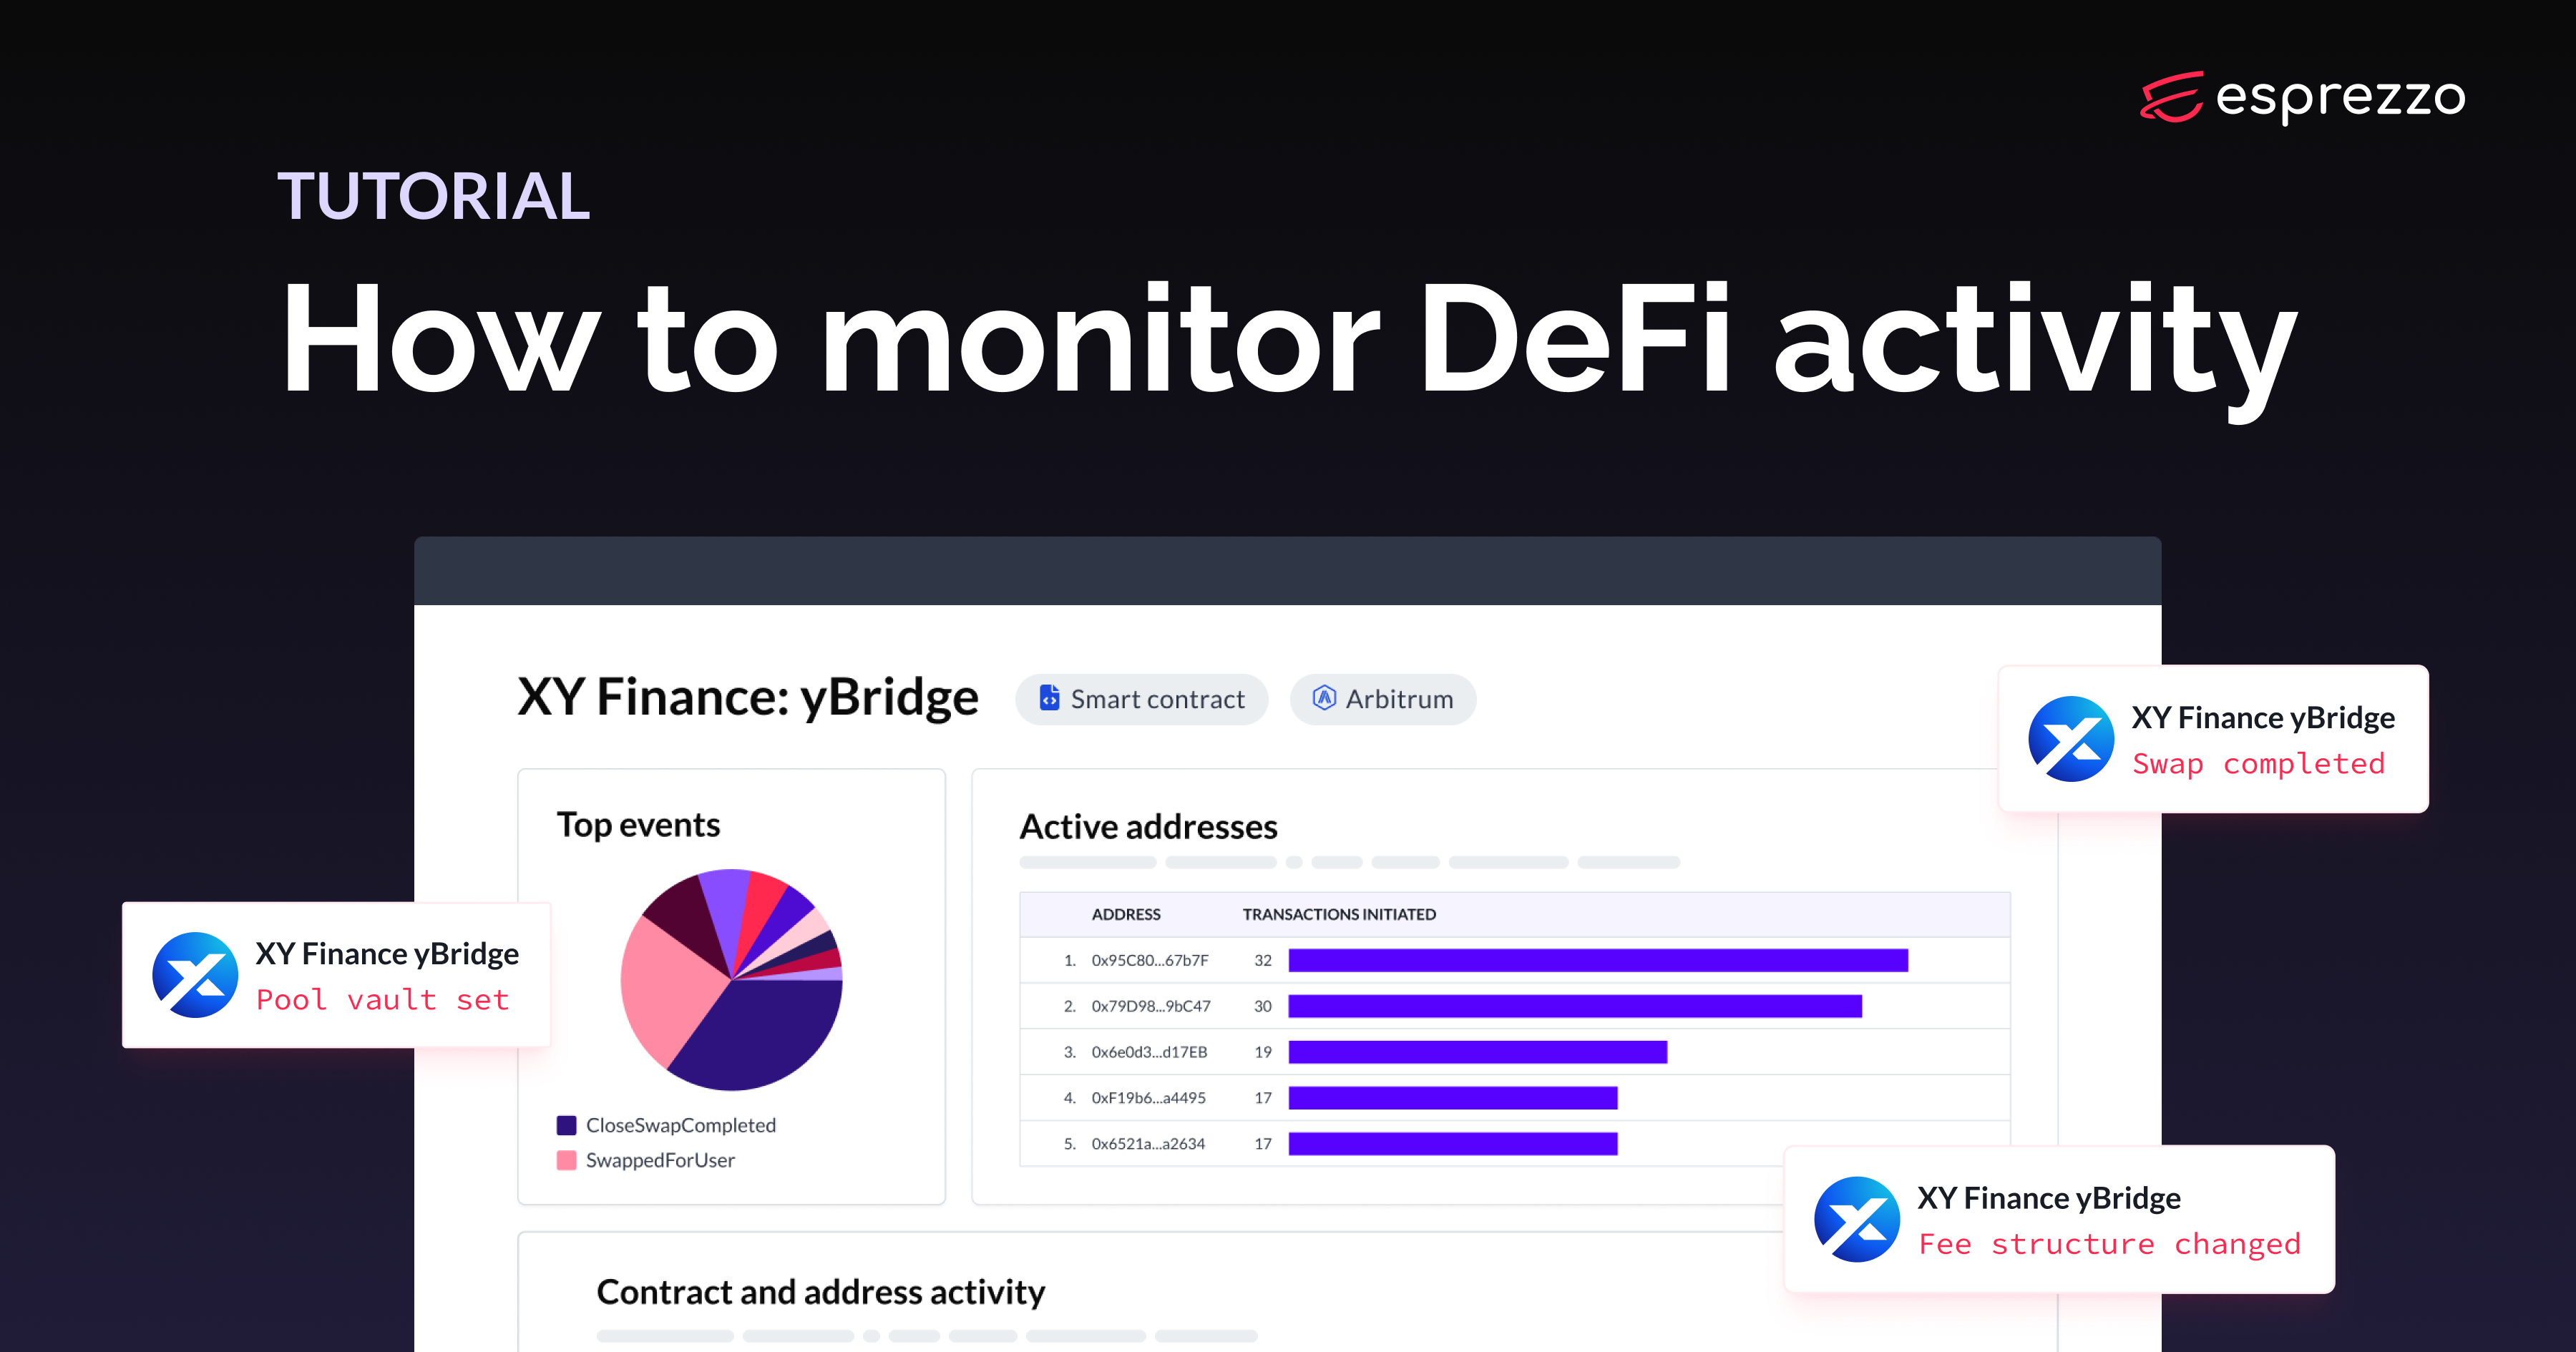
If you're active in DeFi, you know the struggle of keeping up with cross-chain activity. Jumping between different block explorers, constantly refreshing dashboards, and trying to track swaps across multiple chains — it's a lot to handle. And if you're running a project or managing a treasury, missing an important transaction, contract event, or admin change can be a real headache.
Topics: Tutorials
Read moreHow to analyze cross-chain activity with Notion Charts
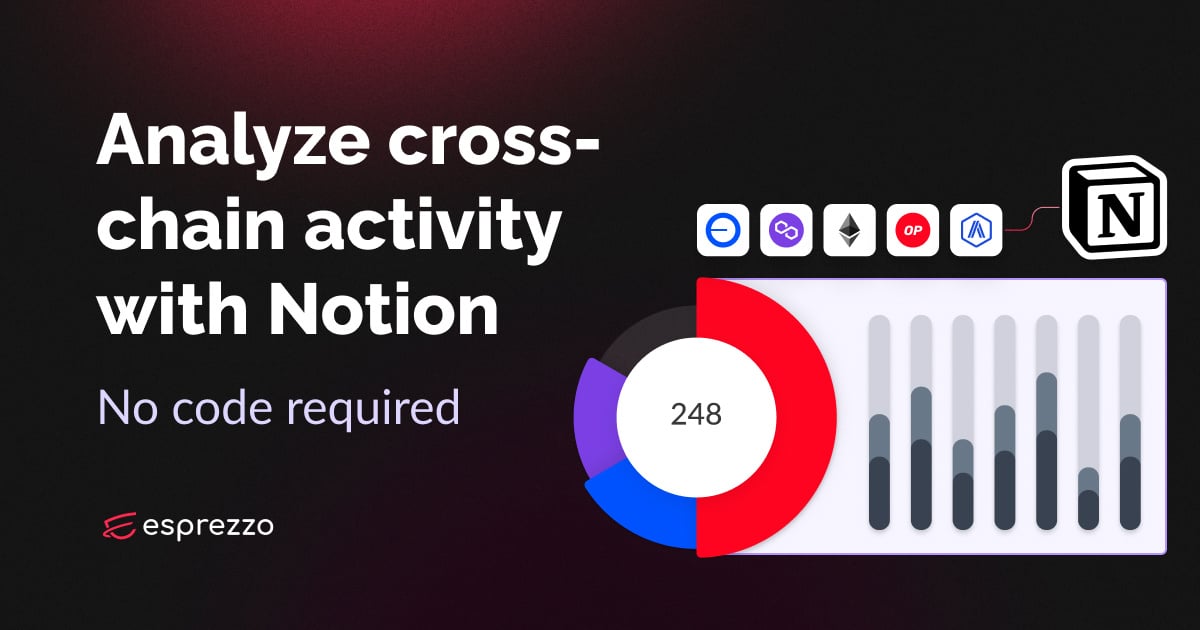
Last month, Notion — the popular productivity and "all-in-one workspace" tool — introduced charts, a long-awaited feature that opens up new possibilities for data visualization and analysis within the platform.
In this guide, we'll show you how to create a self-updating dashboard for visualizing and monitoring USDC activity across multiple blockchains: Ethereum, Arbitrum, Polygon, Base, and Optimism. This dashboard will provide real-time insights into USDC movement, providing another way to identify trends and analyze cross-chain activity.
Topics: Tutorials
Read moreDAO guide: How to use automation for better outcomes
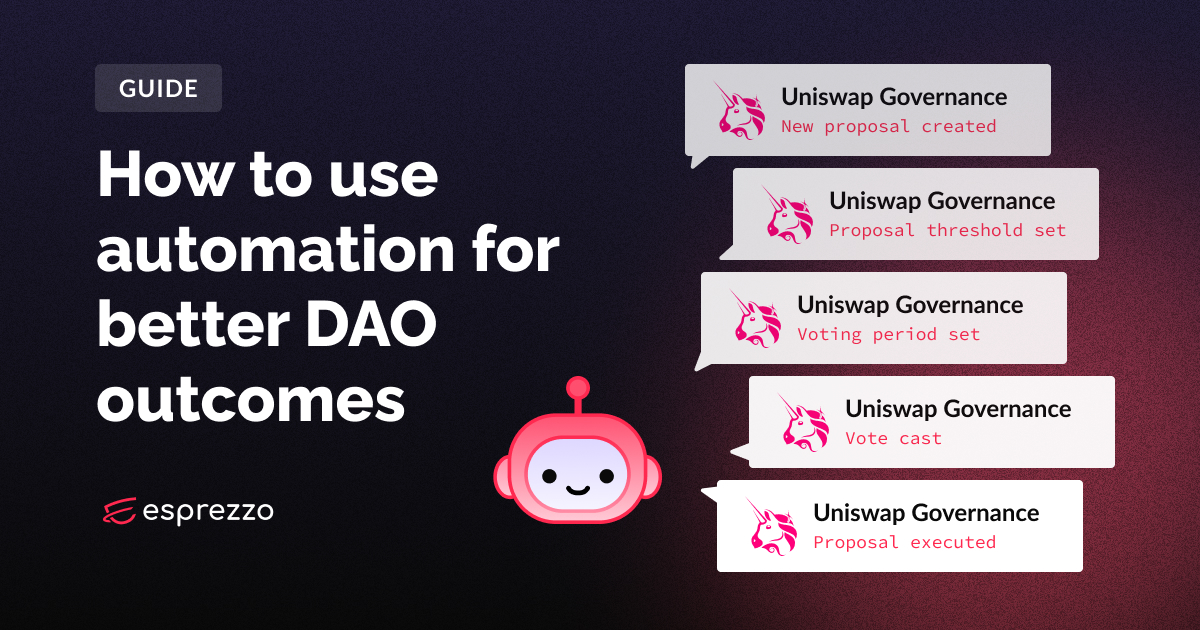
Between proposal creation and execution, delegation, permissions changes, voting, and treasury spending, staying on top of DAO governance activities can be a constant struggle. This guide will show you a few ways you can automatically monitor and communicate real-time updates for critical governance-related activity — whether to your team, or your community.
Topics: Tutorials
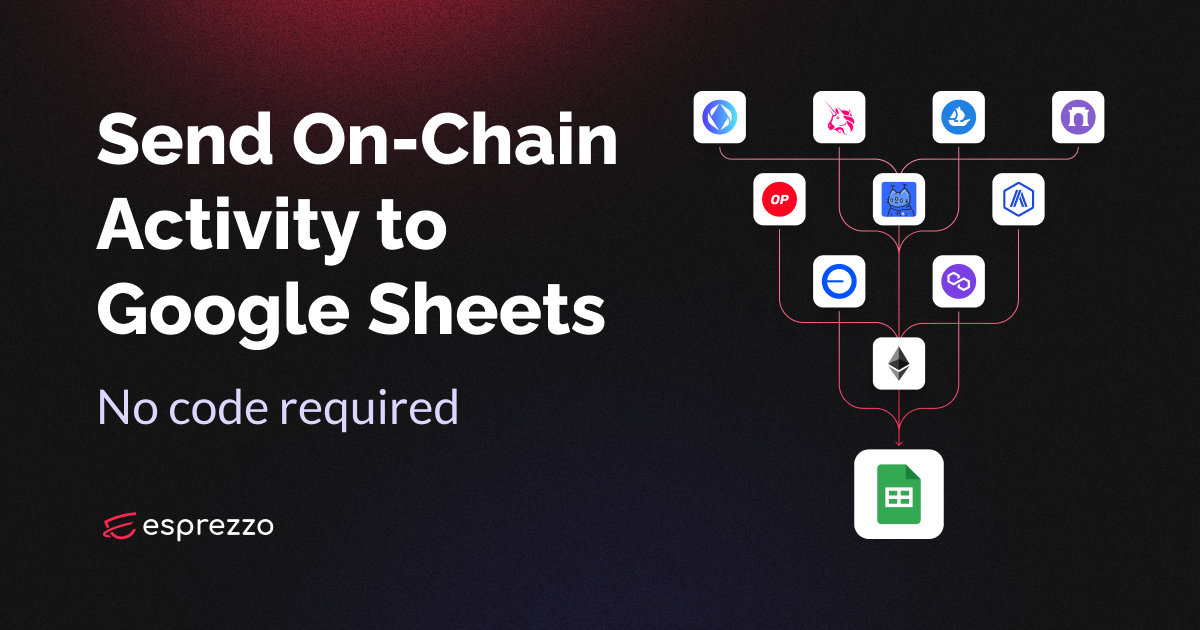
Read moreAutomatically log on-chain activity to Google Sheets without code
Topics: Product updates , Integrations , Tutorials , Webhooks
Read more
